Discrimination Metrics (higher values indicate better discrimination):
KS: Kolmogorov-Smirnov statistic, with values above 0.60 indicating strong discrimination.Gini: Measures discriminatory power in credit scoring.AUC: Area Under the Curve, assessing the model’s ability to distinguish between classes.F1: Harmonic mean of precision and recall, representing accuracy.
Calibration Metrics (lower values indicate better calibration):
RASE: Root Average Squared Error.MCE: Misclassification Error.ASE: Average Squared Error.
After imputation on DEROG, DELINQ, CLAGE is complete, we proceed with model building, selection, and evaluation using SAS Viya Pipelines. To ensure interpretability for scorecard development, we focused on logistic regression, generalised additive models (GAM), and decision trees. However, DEBTINC has missing values, preventing its use with logistic regression or GAM, and decision trees offer only moderate interpretability. Thus, we adopted the following approach:
We first fit a GAM on IMP_CLAGE, IMP_DEROG, and IMP_DELINQ (imputed versions of CLAGE, DEROG, and DELINQ) to obtain log-odds for these variables. We use these log-odds to engineer a new feature, GAM. We then fit a decision tree using GAM and DEBTINC.
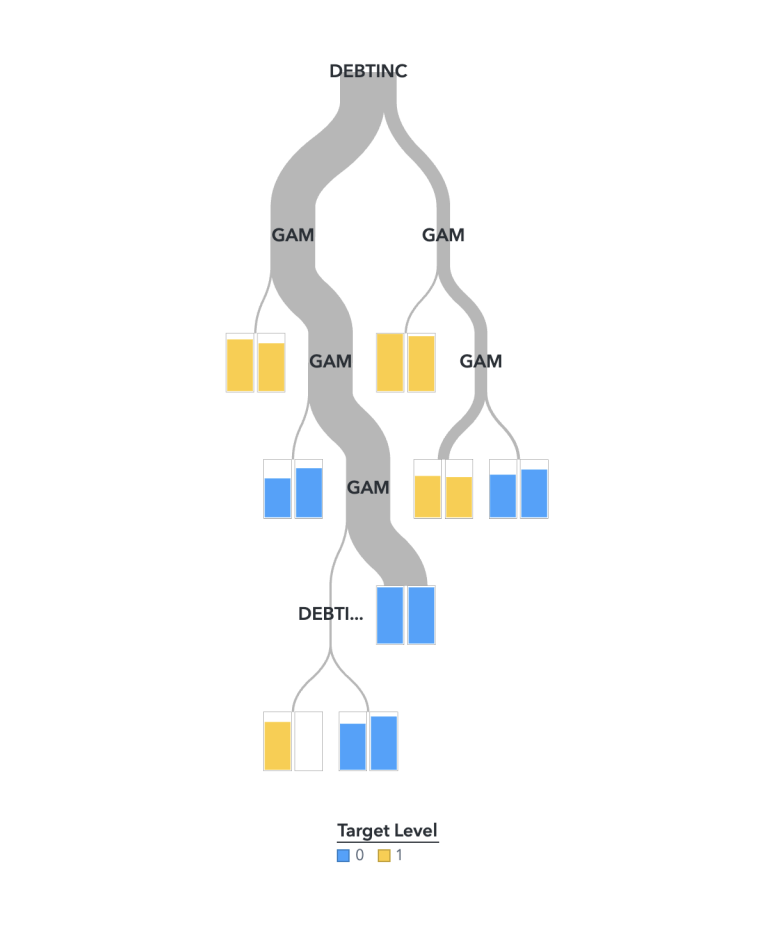
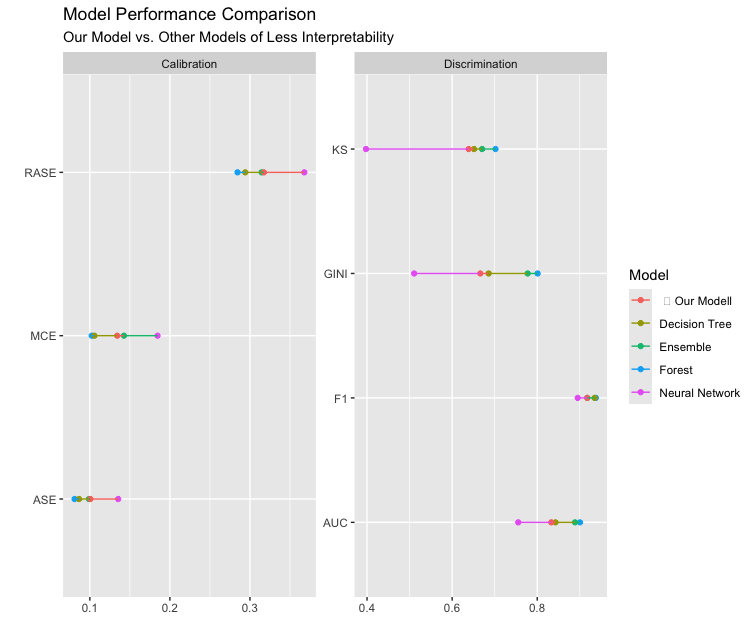
IMP_CLAGE, IMP_DEROG, IMP_DELINQ, and DEBTINC). While our hybrid GAM-Decision Tree model ranks around the average level among models in this assessment, its overall performance is strong, with an F1 score of 0.86 and a KS value of 0.68, indicating high accuracy and solid discrimination power. Given its interpretability, this model is the optimal choice for scorecard development.